1. [Intro] April 2026: A Sudden Shift in Market Winds
The Erosion of Q1 Optimism
The transition into April 2026 has been nothing short of a cold shower for global equity markets. After a jubilant first quarter characterized by record-high valuations and a seemingly unstoppable momentum in the technology sector, the first two weeks of April have introduced a harsh dose of reality. The fundamental narrative that sustained the “soft landing” thesis is beginning to crumble under the weight of incoming data that confirms the presence of Sticky Inflation. As a systems engineer who spent years analyzing failure points in complex networks, I see the current market structure mirroring a system under peak stress where the safety margins have evaporated. The market is no longer reacting to temporary fluctuations; it is reacting to the realization that price pressures have become deeply embedded in the economic architecture. This structural shift is forcing a definitive end to the “Pivot Party” as investors grapple with the fact that the macroeconomic stabilizers we once relied on are no longer functioning as intended in this high-cost environment, leaving the broader indices vulnerable to a significant technical breakdown.
From Pivot Hopes to Survival Realities
The briefing from the early April indicators—specifically the Consumer Price Index (CPI) and the latest non-farm payroll data—suggests that the window for a graceful policy adjustment has slammed shut. Earlier this year, the consensus was focused on when the Fed would cut rates, but the conversation has now shifted to a much more somber question: how do we survive a cycle defined by Sticky Inflation? This shift marks a psychological turning point for the investment community. We are moving from a regime of “buying the dip” based on central bank liquidity to a “survival of the fittest” environment where only companies with genuine pricing power and robust free cash flow can thrive. This post-optimism phase requires a total recalibration of risk parameters for every analyst and retail investor alike. Individuals must recognize that the “Fed Put” is effectively dead when price stability is at risk, leaving traditional 60/40 portfolios and speculative growth positions vulnerable to a synchronized drawdown that few were prepared for at the start of the year.
Engineering a Defensive Strategy
From a systems analysis perspective, the current market failure is not a bug; it is a feature of an over-leveraged economy meeting the wall of Sticky Inflation. In my previous engineering roles, we looked for “cascading failures,” and the simultaneous rise in both the 10-year Treasury yield and the unemployment rate suggests that the gears of the economy are grinding against one another. We must pivot our thinking from chasing “the next big thing” to preserving capital and identifying high-alpha opportunities within companies that possess a “moat” built on necessity rather than hype. The survival strategy for the remainder of 2026 is not about timing the bottom, but about recognizing that the floor of the market has fundamentally moved higher due to these inflationary pressures. As we dive deeper into the specific CPI data and employment metrics in the following sections, keep in mind that the goal is no longer just participation in the market, but the calculated mitigation of systemic risks that were ignored during the euphoric start to the year.
2. CPI & PCE Analysis: Why Prices Refuse to Budge
The Structural Drivers of 3% Inflation
On April 10th, 2026, the Bureau of Labor Statistics released a CPI print of 3.58%, followed closely by a PCE reading of 3.61% on April 9th. These figures have proven devastating for those who expected a linear descent toward the 2% target, confirming that Sticky Inflation is the dominant economic theme of the year. From a data-driven perspective, the persistence of these numbers reveals a structural rigidity in the current economy that many analysts failed to model. This entrenchment is primarily exacerbated by a resurgence in energy prices, driven by geopolitical instability and supply chain bottlenecks that never fully resolved despite the post-pandemic recovery efforts. Furthermore, service-sector inflation—the “super-core” metrics that include housing, healthcare, and insurance—remains aggressively high. In engineering terms, this represents “hysteresis,” where a system’s state resists returning to its original equilibrium even after the initial stressor is removed. Because services are labor-intensive, the wage-price spiral has created a floor under inflation that high interest rates have struggled to break, effectively anchoring the cost of living at levels the market finds intolerable.
Valuation Pressure on the Tech Frontier
This entrenchment of Sticky Inflation at the 3.6% level is particularly toxic for high-growth sectors, acting as a corrosive agent on the valuations of the world’s most innovative companies. When the discount rate used in valuation models remains elevated, the present value of future cash flows—the very bedrock of Big Tech valuation—is drastically reduced. We are currently witnessing a direct correlation between these stubborn inflation prints and the rapid compression of P/E ratios across the Mag-7 and AI-adjacent stocks. The current dilemma forces a fundamental re-evaluation of what constitutes a “fair” multiple in a high-rate environment. If the risk-free rate stays above 4.5% or 5% due to the central bank’s inability to cool the economy, the equity risk premium becomes fundamentally unattractive for stocks trading at 35x earnings. Analysts are now forced to factor in a permanent increase in the cost of capital, which acts as a gravity well for tech giants. Even companies with revolutionary AI technology cannot escape the laws of financial physics; as price pressures prove more resilient than the Fed’s resolve, the “AI premium” is being stripped away.
The Feedback Loop of Service Costs
Looking deeper into the PCE data, the core issue lies in the “sticky” nature of shelter and insurance costs, which do not respond to interest rate hikes as quickly as consumer electronics or apparel. This lag creates a dangerous feedback loop where high interest rates, intended to curb inflation, actually increase the cost of financing new housing supply, thereby keeping rental prices elevated. As a systems analyst, I view this as a positive feedback loop that destabilizes the intended policy outcome. Sticky Inflation in 2026 is no longer just a monetary phenomenon; it is a structural one. Households are seeing a larger percentage of their disposable income swallowed by non-discretionary service costs, which in turn leads to demands for higher wages, further fueling the inflation cycle. This reality puts the Federal Reserve in a precarious position. They are attempting to fight a modern, service-heavy inflation monster with tools designed for a manufacturing-based economy. For the investor, this means that the “inflation hedge” strategies of the past may no longer be sufficient, as the volatility of these service components introduces a level of uncertainty that makes long-term capital allocation increasingly difficult.
3. Employment Indicators’ Warning: What a 4.5% Unemployment Rate Signifies
The Intersection of Stagnant Hiring and Rising Unemployment
The release of the March 2026 Non-Farm Payroll (NFP) and the subsequent rise in the unemployment rate to 4.5% (approaching the 4.6% year-end forecast) has sent shockwaves through the global markets. Only a quarter ago, the labor market appeared impenetrable, but the sudden cooling suggests that corporate America has finally hit a breaking point under the weight of Sticky Inflation. From a systems engineering perspective, this represents a state of “critical damping” where the economy’s momentum is being absorbed by high operational costs and restrictive monetary policy. As high interest rates persist, the cost of maintaining human capital has become a primary target for corporate optimization. We are seeing a “low hire, low fire” regime shift toward more aggressive layoffs in non-core sectors. This rise in unemployment is not merely a statistic; it is a leading indicator that the consumer-driven engine of the U.S. economy is beginning to stall, as the safety margins that protected the “soft landing” narrative have officially evaporated.
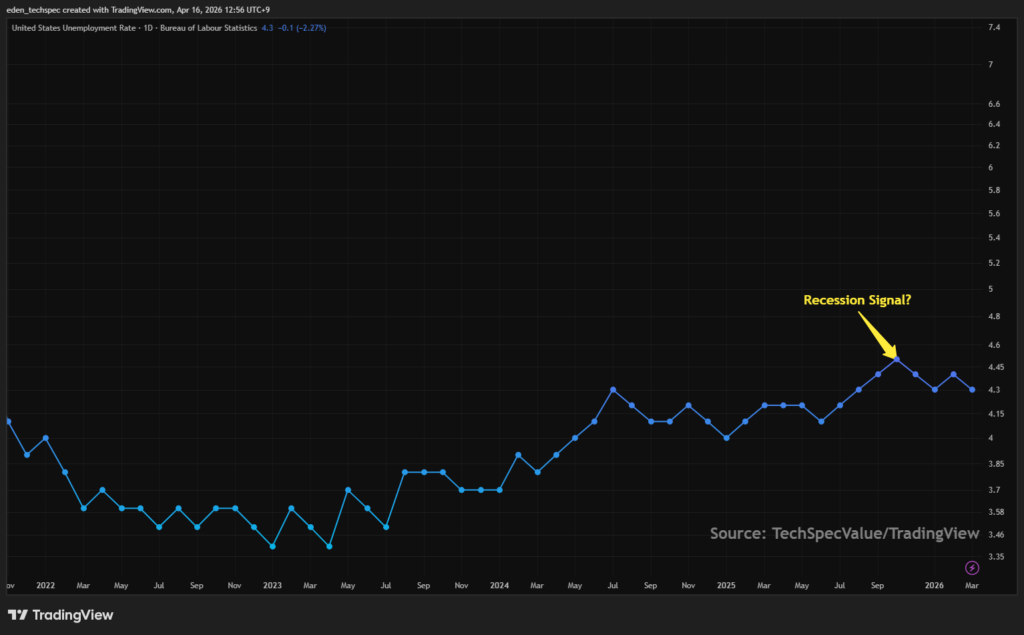
The Sahm Rule and the Recessionary Threshold
The move toward 4.5% unemployment is particularly alarming because it brings the U.S. economy to the doorstep of the Sahm Rule threshold. Historically, when the three-month moving average of the unemployment rate rises by 0.5 percentage points above its low from the previous 12 months, a recession has almost always followed. With Sticky Inflation preventing the Federal Reserve from deploying its usual “liquidity parachute,” the labor market is essentially flying without a net. In engineering terms, when the safety factor of a structural member drops below 1.0, failure is no longer a matter of “if” but “when.” The Sahm Rule is flashing a yellow signal that could turn red by the next FOMC meeting. Investors must now pivot their strategies to account for a “Stagflationary” environment—one where growth is contracting while prices remain stubbornly high—a scenario that historically punishes speculative growth and rewards defensive, cash-rich entities.
Qualitative Decay in the Labor Force
Beyond the headline figures, the “quality” of employment is undergoing a significant decay, further complicating the Sticky Inflation landscape. We are observing a divergence where full-time positions are being replaced by part-time and “gig” labor, leading to a broader U-6 underemployment rate that is trending upward. This structural shift diminishes the aggregate purchasing power of the household sector, even as nominal wage growth remains high due to labor shortages in specialized fields. As a systems analyst, I view this as a depletion of “system energy”—households are losing their ability to absorb price shocks, leading to a rise in credit card delinquencies and a collapse in personal savings rates. This creates a vicious cycle: falling consumer demand leads to lower corporate earnings, which triggers further layoffs. The current 4.5% unemployment rate is the pivot point where the Fed’s battle against inflation begins to exact a heavy toll on the actual livelihood of the population, leaving the market in a state of high-alert volatility.
4. The Fed’s Choice: Chair Powell at a Strategic Deadlock
The Impossible Dual-Mandate Balance
As we approach the late April 2026 FOMC meeting, Federal Reserve Chair Jerome Powell finds himself in what systems engineers call a “deadlock”—a state where two or more processes are waiting for each other to release resources, resulting in total system paralysis. The Federal Reserve’s dual mandate—maintaining price stability while fostering maximum employment—has become a zero-sum game due to Sticky Inflation. On one side, the 3.6% PCE print demands a restrictive “Higher for Longer” stance to prevent inflation expectations from becoming permanently unanchored. On the other side, the climb in the unemployment rate to 4.5% signals that the labor market’s structural integrity is failing. Powell is no longer choosing between “good” and “better” policy; he is choosing which crisis to prioritize. If the Fed cuts rates to save the labor market, they risk a 1970s-style secondary inflation spike. If they hold steady to crush prices, they risk a hard landing that the Sahm Rule suggests is already underway.
The “Higher for Longer” Engineering Trap
The prevailing sentiment in the FOMC minutes suggests that the “Higher for Longer” mantra is shifting from a policy choice to a mathematical necessity. From a data-driven perspective, the Fed’s balance sheet and the current 3.5%–3.75% funds rate are being neutralized by the exogenous shock of rising energy prices and the structural floor of service-sector costs. This is an engineering trap: the tools being used (interest rate hikes) have reached a point of diminishing returns where they cause more collateral damage to the banking and housing sectors than they do to the actual consumer price level. Consequently, the Fed is likely to adopt a “hawkish pause” in late April. This stance aims to keep financial conditions tight enough to suppress Sticky Inflation while essentially crossing their fingers that the unemployment rate stabilizes. However, the market’s realization that a significant rate cut is off the table for 2026 has already begun to trigger a repricing of risk assets, as the “liquidity safety net” investors counted on is being withdrawn to fight the inflation fire.
Predicting the April FOMC Outcome
My analysis suggests that the April 2026 FOMC statement will be the most somber of Powell’s career. The rhetoric will likely shift from “monitoring progress” to “ensuring stability,” a subtle but critical linguistic transition indicating that the Fed is moving into a defensive crouch. They are caught in a pincer movement: the Strait of Hormuz conflict has introduced a supply-side shock that no amount of interest rate hiking can solve, yet they cannot ignore the inflationary optics. The most probable outcome is a commitment to a stagnant rate path well into 2027, effectively sacrificing the “soft landing” goal to maintain the Fed’s credibility as an inflation fighter. For the investor, this means the “cost of carry” for speculative positions will remain prohibitively high. We are entering a period where the Fed is a spectator to the macro chaos rather than the conductor, and the Sticky Inflation we see today is the primary reason their hands are tied behind their backs.
5. [Sector Focus] AI Big Tech: Correction or Structural Collapse?
The Valuation Gravity of High-Rate Regimes
For the first time since the generative AI boom began, the “Magnificent Seven”—led by NVIDIA (NVDA), Microsoft (MSFT), and Alphabet (GOOGL)—are facing a reckoning that transcends technological hype. As of April 2026, the market is no longer pricing these assets based on theoretical TAM (Total Addressable Market) in 2030, but on the cold, hard reality of Sticky Inflation and its impact on terminal value. In my engineering days, we called this a “stress test”; for Big Tech, the stressor is a risk-free rate that refuses to drop. With MSFT and NVDA having experienced pullbacks of roughly 21.8% and 4.7% respectively in the first quarter, the narrative has shifted. The Sticky Inflation environment has compressed P/E multiples, proving that even a 60% year-over-year revenue growth projection cannot protect a stock if the discount rate continues to climb. We are seeing a “valuation gravity” effect where the cost of capital is finally catching up to the exponential growth curves, forcing investors to ask if the AI premium is sustainable in a stagflationary environment.
FCF as the Ultimate Safety Margin
Despite the volatility, there is a fundamental difference between the 2026 tech correction and the 2000 dot-com bust: Free Cash Flow (FCF). Companies like Alphabet and Microsoft are currently sitting on record cash piles—Alphabet alone maintains a net cash balance of approximately $76.9 billion. In a period of Sticky Inflation, these cash reserves act as a “fortress balance sheet,” allowing these giants to self-fund their massive AI infrastructure investments (projected at $530 billion for the sector in 2026) without relying on expensive debt markets. From a systems perspective, this FCF is the “redundant power supply” that prevents a total structural collapse. While their stock prices are being hammered by macro sentiment, their operational resilience remains intact. This creates a divergence where the stock may be in a correction, but the business is still in an expansion phase, providing a unique safety margin for long-term investors who can stomach the short-term price swings.
Strategy: Navigation of Earnings Season Volatility
As we enter the Q1 2026 earnings season, the strategy for AI Big Tech must be one of “disciplined accumulation” rather than “blind FOMC-frontrunning.” The market is currently hypersensitive to guidance; any hint of a deceleration in AI monetization or an increase in CAPEX due to Sticky Inflation impacting hardware costs will lead to sharp, single-day sell-offs. For instance, NVIDIA’s Blackwell architecture ramp-up is a focal point, but investors are punishing even slight margin misses. The optimal play here is to utilize this volatility to build positions in “AI leaders” that are capturing the lion’s share of economic gains—reportedly just 20% of companies are capturing 74% of AI’s value. I recommend waiting for the “post-earnings shakeout” to identify entry points where the technical support levels (like NVIDIA’s 200-day moving average) align with a more reasonable forward P/E, ensuring you aren’t overpaying for growth in an era of persistent price pressure.
6. [Strategy] Immediate Portfolio Calibrations for April 2026
1. Cash Allocation: The Power of Optionality
In an environment defined by Sticky Inflation and a potential Sahm Rule violation, “Cash is King” is no longer just a cliché—it is a strategic imperative. As a systems engineer, I view cash as “headroom” in a system; it allows for sudden adjustments without forcing the liquidation of core assets at a loss. I am currently advocating for a 15–20% cash or cash-equivalent (like short-term T-Bills) position. This liquidity serves two purposes: first, it provides a buffer against the 4.5% unemployment-driven market tremors; second, it provides the “dry powder” necessary to strike when high-quality tech names reach their technical “buy zones.” In a world where the Fed is paralyzed, your personal liquidity is the only “Fed Put” you can truly rely on. By holding cash, you are essentially buying a “call option” on market volatility, allowing you to be the provider of liquidity when the rest of the market is in a forced-selling panic.
2. Defensive Anchors: The SCHD Rebound
The year 2026 has marked the “Great Reconstitution Pivot” for dividend-growth strategies, with the Schwab US Dividend Equity ETF (SCHD) emerging as a premier defensive anchor. While the Nasdaq struggled, SCHD recorded an 11% year-to-date return through March, largely due to its focus on cash-flow-rich companies that can pass on costs to consumers—a natural hedge against Sticky Inflation. Following its March 2023 reconstitution, which shifted weight into Healthcare and Consumer Staples, SCHD now offers a 3.45% yield that is three times that of the S&P 500. For my portfolio, this is the “ballast” that keeps the ship steady. These companies don’t just survive inflation; they grow through it by raising dividends at rates (approx. 11% historically) that outpace the 3.6% PCE. In a “Higher for Longer” world, the steady income and valuation discount of SCHD offer a far superior risk-adjusted return compared to over-leveraged growth stocks or low-yielding broad indices.
3. Tactical Avoidance: The Debt-Sensitivity Trap
Finally, the most critical move right now is the aggressive pruning of “rate-sensitive laggards.” This includes small-cap stocks (Russell 2000) and companies with high debt-to-equity ratios that require constant refinancing. Sticky Inflation ensures that the “cheap money” era is not returning anytime soon, and for companies with floating-rate debt, the interest expense is becoming a terminal illness. I am specifically advising caution regarding mid-tier regional banks and debt-heavy utilities that haven’t secured long-term fixed financing. In a systems failure, the weakest links break first; in this economy, the weakest links are firms that cannot cover their interest payments with current operating cash flow. By rotating out of these “Zombie” companies and into high-quality value or FCF-heavy tech, you are essentially hardening your portfolio against the “cascading failures” that typically follow a rise in unemployment to 4.5% and persistent inflationary pressure.
7. [Outro] The Discipline of the Long-Horizon Investor
Navigating the 2026 Macro Storm
As we have analyzed through the lens of systems engineering and market data, the Sticky Inflation of April 2026 is a structural challenge that demands more than just patience—it requires a total overhaul of tactical positioning. The convergence of persistent 3.6% price growth and a 4.5% unemployment rate has placed the Federal Reserve in a pincer move, effectively neutralizing the traditional “Fed Put” that investors have leaned on for decades. However, history and data show that market cycles of this nature are precisely where the wealth gap between disciplined analysts and speculative traders widens. By focusing on the “fortress balance sheets” of Big Tech and the dividend resilience of ETFs like SCHD, we are not just surviving; we are positioning ourselves to capture the inevitable rebound of high-alpha assets once the system finds its new equilibrium.
Maintaining Fundamental Focus
The noise of daily macro headlines can easily obscure the signal of long-term business performance. While the Sticky Inflation regime may suppress short-term P/E multiples, it cannot indefinitely suppress the compounding power of companies that lead the AI revolution or dominate their respective service niches with massive free cash flow. As an analyst, my final recommendation is to maintain a high “signal-to-noise” ratio in your decision-making. Do not allow the volatility of April to force you into emotional liquidations. Instead, use the 15-20% cash allocation we discussed to act as the market’s “pressure valve,” buying when fear is highest and the technical indicators are oversold. Remember, the goal of a TechSpecValue strategy is to build a portfolio that is robust under stress and explosive during recovery.
Further Reading:
- Amprius Technologies: The Explosive Growth Path to $30 (2026 Analysis)
- Solid Power SLDP Analysis: Game-Changing Breakthrough or Mirage?
Related Content:
- Portfolio Insights: Why FCF is the Ultimate Defensive Metric in 2026
- Federal Reserve Bank of St. Louis: Tracking the Sahm Rule
- Market Strategy: Surviving the Higher-for-Longer Interest Rate Trap