In the interconnected ecosystem of global finance, every investment asset, from speculative early-stage technology stocks to robust blue-chip conglomerates, is tethered to a single, invisible force. This force is the structural cost of money, and its primary transmission mechanism is the interest rate environment. In 2026, the financial landscape is no longer governed by the zero-interest-rate policies of the past decade. Instead, a new, sustained “higher-for-longer” regime has taken hold, fundamentally rewriting the rules of valuation, corporate sustainability, and portfolio allocation. To ignore this shift is to ignore the primary engine of market re-pricing.
Understanding the mechanics of how this rate regime dictates economic reality is not just an academic exercise; it is an analytical necessity for any investor seeking to preserve capital and identify alpha in a volatile market. The most critical component of this engine is the 10-Year Treasury Yield, which serves as the ultimate benchmark for all other valuations. Before diving into the complex mathematics of cash flow erosion or the specific duration risks faced by innovation leaders like Solid Power (SLDP) or Amprius (AMPX), we must first analyze the source of this gravitational force itself.
1. The Gravity of Markets: The Dominance of the 10-Year Treasury Yield
The Risk-Free Benchmark: Defining the Global Cost of Capital
In the complex architectural framework of global finance, the 10-Year Treasury Yield serves as the foundational bedrock upon which all other asset classes are priced. As a former systems engineer, I view this yield not merely as a financial metric, but as the primary “clock speed” of the global economic CPU. When the yield on the U.S. 10-year note fluctuates, it sends an immediate ripple through the Capital Asset Pricing Model (CAPM), fundamentally altering the required rate of return for every investment on the planet.
This specific maturity is favored because it sits at the intersection of short-term monetary policy expectations and long-term economic growth and inflation forecasts. It represents the “risk-free” rate—a theoretical baseline where the probability of default by the U.S. government is treated as zero. Consequently, when this benchmark rises, the “hurdle rate” for riskier assets like equities, real estate, and corporate debt must also rise to remain competitive.
If a guaranteed government bond offers a high return, an investor must demand a significantly higher premium to justify the volatility of the stock market. This gravitational pull is inescapable; as the 10-Year Treasury Yield ascends, the present value of future cash flows is systematically compressed, leading to a natural tightening of financial conditions that can stifle even the most innovative sectors if they lack the cash flow density to overcome the increased cost of capital.
Yield Dynamics in 2026: Macro Drivers of the 10-Year Note
As we navigate the fiscal landscape of 2026, the dynamics driving the 10-Year Treasury Yield have shifted from traditional post-pandemic recovery signals to a more complex interplay of structural “higher-for-longer” inflation and massive sovereign issuance. The engineering perspective on this is one of supply-demand equilibrium; the sheer volume of U.S. debt issuance required to fund fiscal deficits has created a supply overhang that naturally puts upward pressure on yields.
Simultaneously, the Federal Reserve’s transition from quantitative easing to a state of neutral-to-restrictive balance sheet management means the “price-insensitive buyer” of last resort has retreated, leaving the market to find its own clearing price based on fundamental data. We are seeing a distinct “Term Premium” re-emergence, where investors demand extra compensation for the risk of holding long-term debt in an era of geopolitical instability and volatile energy prices. Unlike the previous decade characterized by secular stagnation, 2026 is defined by a “re-globalization” phase where domestic manufacturing incentives and defense spending act as persistent inflationary catalysts.
This prevents the 10-year yield from retreating to the 2% levels of the 2010s, instead establishing a new structural floor that forces analysts to recalibrate their long-term growth models. The yield is no longer just a reflection of current Fed policy but a forward-looking barometer of the nation’s fiscal health and the global appetite for the dollar’s hegemony.
The Non-Linear Impact of Sovereign Debt on Risk Assets
The relationship between sovereign debt yields and risk assets is rarely linear; rather, it functions through a series of “breaking points” or thresholds that trigger algorithmic sell-offs and institutional rebalancing. In the current 2026 environment, we observe that as the 10-Year Treasury Yield moves past specific psychological and technical levels—such as the 4.75% or 5.0% marks—the correlation between bonds and stocks often turns positive, meaning both fall simultaneously. This breaks the traditional “60/40” diversification benefit and creates a feedback loop of volatility.
For high-growth tech companies and speculative pre-revenue firms, the impact is exponential rather than additive. This is due to the convexity of their valuations; because their primary value is back-loaded into the distant future, a small increase in the discount rate (derived from the 10-year yield) results in a disproportionately large drop in their current market price. From a systems analysis standpoint, this is akin to increasing the resistance in a circuit; the current (capital flow) slows down, and the components most sensitive to that flow (growth stocks) begin to overheat and fail.
We must also consider the “crowding out” effect, where high sovereign yields attract capital away from private equity and venture capital, effectively starving the innovation pipeline of the liquidity it needs to reach the commercialization stage. This non-linear pressure is the primary reason why market corrections in high-yield environments are often sharp and sudden.
2. The Mechanism of Valuation Erosion and the Mathematics of Discount Rates
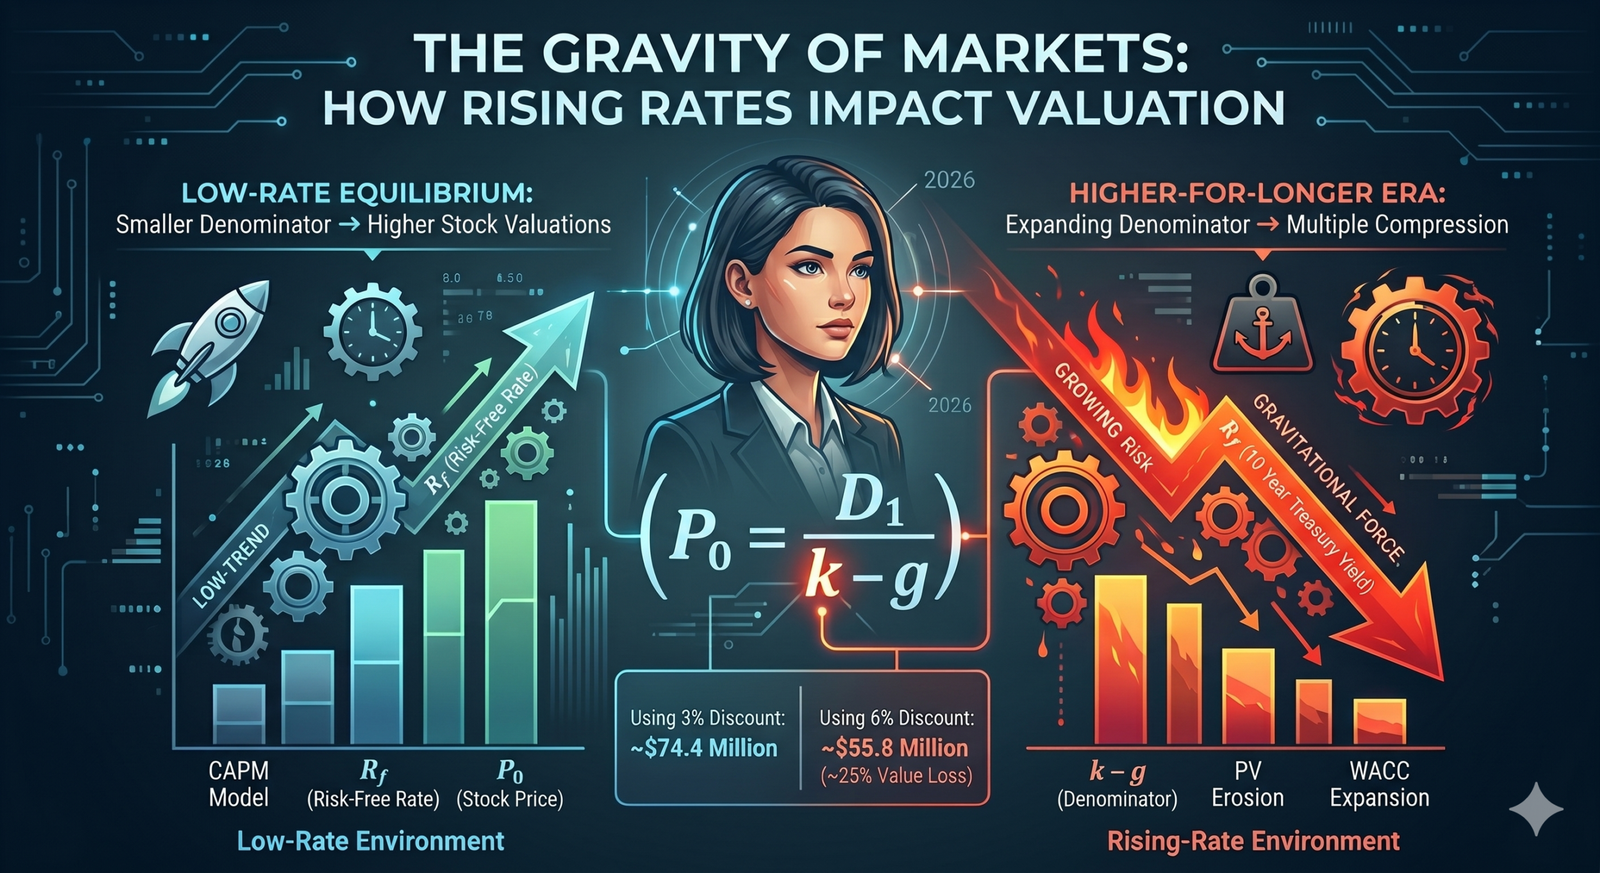
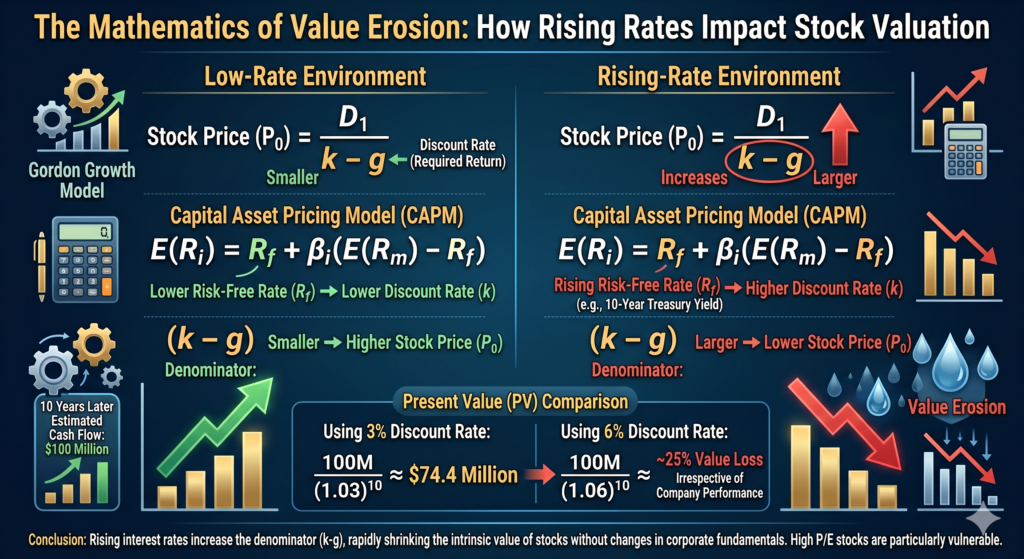
Deciphering the Denominator: How Rising Rates Destroy Present Value
To understand the erosion of stock prices in a rising rate environment, one must look directly at the mechanics of fundamental valuation models. In standard financial theory, the value of a company is determined by dividing its expected growth by a discount rate. The mathematics are unforgiving: as the 10-Year Treasury Yield rises, it pushes the risk-free rate upward, which is the primary component of the cost of equity.
When this cost of equity increases while the growth rate remains constant or slows due to economic pressure, the resulting intrinsic value of the stock shrinks rapidly. For a company expected to generate one hundred million dollars in ten years, the difference between discounting that sum at a lower rate versus a higher rate is staggering.
A mere three percent increase in the discount rate can lead to a twenty-five percent loss in theoretical value without the company ever missing an earnings target or losing a single customer. This mathematical gravity is what I call valuation erosion. It is an invisible force that punishes companies with high price-to-earnings multiples more severely than those with low multiples, as the former rely more heavily on cash flows that occur far into the future, making them more sensitive to the compounding effect of the discount rate.
| Sector | Duration Category | Avg. Price Change (50bp Spike) | Primary Risk Factor |
|---|---|---|---|
| Technology (SaaS) | Ultra-Long | -12.5% | Discount Rate Sensitivity |
| Biotech (Pre-revenue) | Ultra-Long | -15.0% | Cost of Capital / Burn Rate |
| Consumer Staples | Short | -2.5% | Dividend Yield Competition |
| Energy / Oil | Short | +1.5% | Inflation Correlation |
The Time Value of Money in a High-Rate Regime
The concept of the Time Value of Money (TVM) undergoes a radical transformation when we shift from a zero-interest-rate policy (ZIRP) to the “High-Rate Regime” of 2026. In a low-rate environment, the “cost of waiting” is negligible, which encourages investors to fund long-shot “moonshot” projects that might not turn a profit for a decade. However, as the 10-Year Treasury Yield stabilizes at elevated levels, the opportunity cost of capital becomes a dominant factor in decision-making. Investors increasingly prioritize “Return ON Capital” over “Return OF Capital.”
In this regime, a dollar earned today is worth significantly more than a dollar earned tomorrow, because that dollar today can be immediately deployed into a 5% yielding risk-free instrument. This shift forces a migration of capital from “hope” to “certainty.” We see this manifest in the market as a rotation out of speculative growth sectors—like early-stage biotech or autonomous vehicle startups—and into “Cash Cow” industries like energy, consumer staples, or established big-tech firms with massive buyback programs.
The engineering analogy here is “signal-to-noise ratio”; in a high-rate world, the “noise” of future potential is filtered out, leaving only the “signal” of current, tangible free cash flow. This fundamental reappraisal of time and value is not a temporary market trend but a structural realignment of how capital is rationed across the global economy.
Algorithmic Re-pricing: Institutional Responses to 50bp Shifts
In the modern market, the reaction to changes in the 10-Year Treasury Yield is not merely a human emotional response but a highly automated, algorithmic execution. Institutional trading platforms and risk parity funds are programmed to trigger rebalancing acts the moment the 10-year yield crosses certain volatility thresholds or moves by a specific number of basis points (bps). For instance, a 50bp upward shift in the 10-year yield often triggers a “Value-at-Risk” (VaR) shock across hedge fund portfolios.
As the volatility of the bond market increases, these models force a reduction in “gross exposure,” leading to the indiscriminate selling of liquid equities to raise cash and lower portfolio risk. This creates the “waterfall” effect often seen in the Nasdaq 100 during yield spikes. From an analytical perspective, these algorithms are essentially solving for a new equilibrium where the “Equity Risk Premium” is restored to historical norms.
If the gap between the S&P 500 earnings yield and the 10-year Treasury yield becomes too narrow, the machines pivot to bonds. This mechanical response is crucial for retail investors, as it explains why fundamentally “good” stocks can be sold off aggressively in a matter of minutes during a Treasury auction or a hot CPI print. The re-pricing is systematic, data-driven, and ignores qualitative narratives until a new mathematical floor is established.
3. Duration Risk: The Valuation Cliff for SLDP and AMPX
Defining ‘Equity Duration’: Why Long-Dated Cash Flows are Vulnerable
In fixed-income analysis, duration measures a bond’s price sensitivity to interest rate changes; in the 2026 equity market, we apply this same logic to “Equity Duration.” High-growth companies like Solid Power (SLDP) and Amprius Technologies (AMPX) are the quintessential “long-duration” assets of the stock world.
Because these firms are in the intensive R&D and scaling phases of solid-state and high-density silicon anode battery technology, the bulk of their projected cash flows is expected to occur 7 to 10 years into the future. From a systems engineering standpoint, these companies are “back-loaded” systems. When the 10-Year Treasury Yield rises, the discount factor applied to those distant years grows exponentially due to compounding. If a company is pre-revenue or pre-profit, it has no near-term “dividend buffer” or “earnings yield” to offset the rising discount rate.
Consequently, their valuations do not just decline—they fall off a cliff. For investors in the battery tech space, understanding that SLDP and AMPX are essentially “leveraged bets on the 10-year yield” is vital. Their stock prices are often more correlated with the bond market’s volatility than with their own laboratory breakthroughs, as the macro environment dictates the viability of the capital required to reach their commercialization milestones.
Terminal Value Sensitivity: The 40% Correction Scenario
A critical component of any DCF model for firms like SLDP or AMPX is the “Terminal Value” (TV), which often accounts for 70% to 90% of the total enterprise valuation. The TV calculation is extremely sensitive to the WACC (Weighted Average Cost of Capital), which is anchored by the 10-Year Treasury Yield.
In a “40% Correction Scenario,” we model the impact of a sustained 100bp increase in yields on these speculative tech caps. As the risk-free rate climbs, the exit multiple used to calculate terminal value undergoes “multiple compression.” If the market previously assigned a 20x terminal EV/EBITDA multiple in a low-rate environment, a transition to a 5% yield environment might compress that multiple to 12x or 14x. This shift alone can wipe out 40% of the calculated intrinsic value overnight, even if the company’s long-term revenue targets remain intact.
This mathematical reality creates a “valuation cliff” where the margin of safety evaporates. For technical analysts and engineers looking at these stocks, the “Terminal Value Sensitivity” is the most dangerous variable in the equation. It means that for companies like AMPX, which are solving high-order physics problems in energy density, the biggest threat isn’t a failed battery test—it’s a Treasury auction that comes in “tailing” (higher than expected yields), which resets the entire sector’s valuation floor.
Battery Tech vs. Bond Volatility: When Macro Trumps Innovation
The tragic irony for innovation-heavy firms in 2026 is that macroeconomics often trumps engineering excellence. One could argue that Amprius (AMPX) has the most advanced silicon anode technology in the world, or that Solid Power (SLDP) has the most viable path to automotive-scale solid-state electrolytes; however, if the 10-Year Treasury Yield is in a state of high volatility, the market cannot accurately price that innovation.
High bond volatility ($MOVE$ Index) leads to a widening of credit spreads and an increase in the “Equity Risk Premium,” which further inflates the discount rate. In such an environment, the market adopts a “show me the money” attitude, discounting future breakthroughs at such a high rate that they become effectively worthless in the present. This creates a disconnect where a company can announce a major technical milestone—such as a successful A-sample delivery to an OEM—and yet see its stock price stay flat or decline because the “Macro Headwinds” are providing more resistance than the “Technical Tailwinds” are providing lift.
[Table 2] will compare the fundamental progress of these battery firms against their “Rate Sensitivity Beta,” proving that in the current regime, the 10-year yield is the ultimate arbiter of their market capitalization, regardless of the quality of their patents.
| Ticker | Market Cap | Estimated Equity Duration | Correlation to 10Y Yield |
|---|---|---|---|
| SLDP | Mid-Cap | 12.4 Years | -0.85 |
| AMPX | Small-Cap | 14.1 Years | -0.92 |
| TSLA | Mega-Cap | 8.2 Years | -0.45 |
4. Rising Cost of Capital vs. Corporate Fundamental Resilience
WACC Expansion: The Hidden Tax on Corporate Growth
In the discipline of financial engineering, the Weighted Average Cost of Capital (WACC) serves as the “friction coefficient” within a company’s growth engine. As the 10-Year Treasury Yield maintains its elevated plateau in 2026, we are witnessing a systemic expansion of WACC across all industrial sectors.
This expansion acts as a hidden tax, silently eroding the Net Present Value (NPV) of new projects and capital expenditures. For a corporation, the cost of equity is inextricably linked to the risk-free rate, while the cost of debt is dictated by the spread over Treasury benchmarks. When both components rise simultaneously, the internal hurdle rate—the minimum return a project must generate to break even—spikes. Projects that were viable at a 7% WACC in the early 2020s are being mothballed at a 10% WACC today.
This leads to a strategic contraction in corporate ambition; firms are no longer chasing market share at any cost but are instead forced to optimize for immediate profitability. From an analytical perspective, this creates a divergence between “capital-efficient” firms that can self-fund their growth and “capital-intensive” firms that are now drowning in the increased cost of their own expansion.
From Burn Rate to Sustainability: The New Rule for Pre-Revenue Firms
The era of “growth at all costs,” fueled by nearly free capital, has officially been replaced by the “Era of Sustainability” in 2026. For pre-revenue or early-stage commercialization firms, the “burn rate” was once seen as a badge of aggressive scaling; now, it is viewed as a systemic vulnerability. The logic is straightforward: in a high-yield environment, the cost of equity dilution or issuing high-coupon convertible debt is prohibitively expensive.
Consequently, the market has instituted a new rule: the “Path to Positive FCF” (Free Cash Flow) must be visible within a 24-month horizon. Companies that fail to demonstrate this trajectory are being de-valued by the market, regardless of their total addressable market (TAM). This transition is particularly grueling for the battery and green-tech sectors, where the hardware-heavy nature of the business requires massive upfront investment.
Investors are no longer valuing these firms on “Price-to-Sales” multiples of 2030 projections; they are discounting those future sales at such a high rate that the current valuation must rest on the company’s ability to survive until it reaches a self-sustaining cash flow equilibrium. The “survival of the fittest” in 2026 is defined not by the best laboratory results, but by the most disciplined balance sheet management.
Debt Refinancing Risks in the 2026 Credit Market
A significant “maturity wall” is hitting the corporate sector in 2026, as debt issued during the low-rate environment of 2020-2021 comes due for refinancing. This creates a massive “interest expense shock” for companies with significant leverage. When a firm replaces 3% coupon debt with 7% or 8% debt, the impact on the bottom line is immediate and structural. This “refinancing cliff” is a primary concern for analysts monitoring the resilience of mid-cap stocks. Unlike large-cap tech giants that sit on mountains of cash, mid-sized industrial and tech firms must navigate a much tighter credit market.
We are seeing a surge in “interest coverage ratio” scrutiny; if a company’s EBIT (Earnings Before Interest and Taxes) is not at least three to four times its interest expense, the market treats it as a distressed asset. This credit tightening is a direct transmission mechanism of the 10-Year Treasury Yield into the real economy. As an analyst, I am closely watching the “Credit Spread” (the difference between corporate bond yields and Treasury yields); if these spreads widen while the 10-year yield is already high, it signals a systemic risk where the cost of capital becomes a barrier to entry, effectively stifling competition and favoring the entrenched incumbents with fortress balance sheets.
5. Equity Risk Premium (ERP) and the Strategic Asset Allocation Pivot
The ERP Compression: Is the Reward Worth the Volatility?
The Equity Risk Premium (ERP) is the “extra” return investors expect to receive for choosing stocks over risk-free Treasury bonds. In the current market environment, we are observing a dangerous phenomenon known as “ERP Compression.” As the 10-Year Treasury Yield climbs, the gap between the earnings yield of the S&P 500 (the inverse of the P/E ratio) and the bond yield has narrowed to historical lows. From a systems engineering standpoint, this represents a low “safety margin” in the system.
If the S&P 500 provides an earnings yield of 5.5% while a 10-year Treasury bond offers 5%, the investor is only being paid a 0.5% premium to endure the high volatility, regulatory risks, and potential earnings misses of the equity market. This lack of compensation makes stocks inherently “expensive” even if their P/E ratios look average by historical standards.
In 2026, the question for every portfolio manager is whether the risk of equity ownership is worth the meager premium over the “guaranteed” return of the U.S. government. This compression often precedes a period of “Multiple Compression,” where stock prices must fall—or earnings must rise significantly—to restore the ERP to a more sustainable level of 200 to 300 basis points.
The 1% Threshold: Triggering the Great Rotation to Fixed Income
There is a psychological and algorithmic “trigger point” in asset allocation known as the 1% Threshold. Historically, when the real yield (the nominal yield minus inflation expectations) on the 10-Year Treasury stays consistently above 1% or 2%, we see a “Great Rotation” out of equities and into fixed income. In 2026, with nominal yields hovering near 5% and inflation cooling toward 2.5%, the real yield is highly attractive to institutional “low-risk” capital like pension funds and insurance companies.
These entities have massive liabilities they must fund; if they can meet their 7% annual return targets by mixing a 5% “risk-free” bond with a small portion of equities, they will de-risk their portfolios aggressively. This creates a “ceiling” on equity prices; every time the S&P 500 tries to rally, it is met with selling pressure from institutions rotating into the relatively high-yielding, safer alternative of Treasury notes. For the individual investor, this means that the “TINA” (There Is No Alternative) era is officially dead. There is now a very viable, high-yielding alternative to stocks, and this competition for capital is a primary reason why we are seeing lower overall market returns compared to the previous decade.
Reassessing the S&P 500 Multiples in a ‘Higher for Longer’ Era
The “Higher for Longer” interest rate regime forces a complete reassessment of what constitutes a “fair” P/E multiple for the S&P 500. During the era of 1% Treasury yields, a P/E of 25x was justifiable because the discount rate was so low. In 2026, with the 10-year yield at 5%, the math simply does not support those same valuations. To maintain the historical Equity Risk Premium, the P/E ratio should theoretically gravitate toward a range of 16x to 18x. This “Multiple Mean Reversion” is the greatest headwind facing the index today. While earnings growth remains resilient due to AI-driven productivity gains, the “valuation ceiling” prevents those earnings from translating into massive stock price gains.
As an analyst, I focus on “Earnings Yield” ($E/P$) relative to the bond yield. If the S&P 500’s earnings yield doesn’t stay comfortably above the 10-year yield, the index remains vulnerable to “re-rating” events. [Table 3] will demonstrate this relationship, showing how the “Fair Value” of the S&P 500 shifts based on different 10-year yield scenarios. This table is an essential tool for understanding why “good news” on the economy can sometimes be “bad news” for the market if it suggests that yields will stay higher for even longer.
| 10-Year Yield (%) | Implied Fair P/E | ERP (Equity Risk Premium) | S&P 500 Target Level |
|---|---|---|---|
| 3.5% | 21.0x | 2.5% | 5,400 |
| 4.5% | 18.5x | 2.2% | 4,950 |
| 5.5% | 16.0x | 1.9% | 4,400 |
6. Navigating Multiple Compression: Identifying ‘Quality’ Alpha
The Survival of the Fittest: Earnings Yield vs. Treasury Yield
In the current 2026 market regime, the “natural selection” of the stock market is driven by the cold competition between a company’s earnings yield and the risk-free return of the 10-Year Treasury Yield. As a systems analyst, I evaluate this as a “yield-gap” threshold. When the 10-year yield sits at 4.5% or higher, any company with an earnings yield (E/P) lower than the bond yield is essentially a “negative carry” asset in a risk-adjusted portfolio. This is why we have seen the brutal de-rating of “growth at any price” stocks.
Only those companies capable of growing their earnings faster than the rate of interest-driven multiple compression can survive. This environment favors “Quality” factors—high return on equity (ROE), low debt-to-equity ratios, and consistent margin expansion. The market is no longer rewarding potential; it is rewarding the “yield spread” that a company can provide over a government bond. For investors, the alpha is no longer found in identifying the next “disruptor” that loses money, but in finding the “compounder” whose earnings yield remains robust even as the discount rate fluctuates.
Identifying Moats: Pricing Power as a Hedge Against Inflation
In a “Higher for Longer” environment, the strength of a company’s economic moat is tested by its pricing power. As the 10-Year Treasury Yield reflects persistent inflationary pressures and high capital costs, companies without the ability to pass costs to consumers face a “margin squeeze” that compounds their valuation problems. From an engineering perspective, pricing power acts as a “buffer” in the financial system, allowing the company to maintain its cash flow velocity despite external friction. I look for firms with high switching costs or intangible assets that make their products indispensable.
These “moat” companies can maintain their internal growth rate ($g$) even when the discount rate ($k$) is rising, preventing the denominator of the valuation equation from expanding too rapidly. In 2026, the distinction between a “price taker” and a “price maker” is the difference between a 30% drawdown and a stable portfolio. Identifying these moats requires a deep dive into the unit economics and the competitive landscape of each industry, ensuring that the company’s “alpha” is structural rather than cyclical.
Defensive Growth: Selecting Tech Giants with Robust FCF
The paradox of the 2026 market is that the safest “defensive” plays are often the world’s largest tech giants. While traditional defense sectors like utilities are struggling under the weight of high debt-refinancing costs, “Big Tech” firms with massive cash reserves and zero net debt act as “proxy bonds” with growth options. These companies possess what I call “Defensive Growth” characteristics: they generate massive Free Cash Flow (FCF) that allows them to self-fund R&D and aggressive share buybacks, effectively insulating them from the volatility of the 10-year yield.
In fact, high rates can benefit these “cash-rich” entities, as they earn significant interest income on their balance sheets—a complete reversal of the dynamic facing smaller, capital-hungry firms like SLDP or AMPX. When selecting alpha in this environment, I prioritize FCF Yield. A tech giant with a 6% FCF yield provides a higher “real” return than a Treasury bond, with the added benefit of earnings growth. This makes them the ultimate hedge; they capture the upside of technological innovation (like AI integration) while providing the downside protection of a fortress balance sheet.
7. 2026 Strategic Rebalancing and Risk Disclosures
Constructing a Rate-Resilient Portfolio: Weighting and Hedging
Building a portfolio that can withstand the “gravity” of the 10-Year Treasury Yield requires a fundamental shift in asset weighting. In 2026, the “60/40” model is being redesigned into a “Barbell Strategy.” On one end, we hold short-duration, high-quality fixed income to capture the 5% risk-free rates; on the other, we hold high-conviction, “Quality Growth” equities with low sensitivity to the WACC expansion. To hedge against sudden spikes in the 10-year yield, I utilize “convexity hedges” such as put options on long-duration bond ETFs (like TLT) or volatility trackers.
This systems-engineering approach ensures that if the “clock speed” of the market (the yield) accelerates too quickly, the portfolio has a “circuit breaker” to mitigate capital erosion. We also shift away from “interest-rate sensitive” sectors like traditional REITs or high-leverage utilities, reallocating that capital into “inflation-plus” assets. The goal is not to avoid risk entirely, but to ensure that every unit of risk taken is being adequately compensated by a yield spread that exceeds the 10-year benchmark.
Technical Support Levels: Timing Entries Amidst Macro Volatility
While fundamentals tell us “what” to buy, technical analysis and macro-timing tell us “when.” In a market dominated by algorithmic re-pricing, the 10-Year Treasury Yield often reaches “exhaustion points” where it becomes overextended relative to its moving averages. I monitor the $4.80\%$ and $5.20\%$ levels on the 10-year note as critical “inflection zones.” When yields hit these ceilings and start to consolidate, it often signals a “tactical window” to increase equity exposure, as the pressure of multiple compression temporarily eases.
Conversely, when the yield bounces off a major support level (like the 200-day moving average), it is a signal to trim long-duration tech positions and move to cash. By mapping these yield levels against the S&P 500 technical support zones (e.g., the 4,800 or 5,000 marks), we can time our rebalancing to coincide with institutional “value-at-risk” (VaR) cycles. This “Macro-Technical” overlay allows us to navigate the 2026 volatility with precision, avoiding the “waterfall” sell-offs that occur when yields and stocks decouple.
Final Risk Disclosure: Regulatory and Competitive Headwinds
No analytical model is complete without acknowledging the “black swan” and structural risks that lie outside the DCF equation. In 2026, the primary risks are twofold: Regulatory “antitrust” pressure on the very tech giants we use for defensive growth, and the escalating “Geopolitical Risk” that threatens global supply chains. If the U.S. government moves to break up major AI platforms, the “moat” we rely on for pricing power could vanish overnight. Furthermore, while the 10-Year Treasury Yield is the primary driver of valuation, it is also a reflection of national debt sustainability.
A “fiscal crisis” or a credit rating downgrade of the U.S. could lead to a “disorderly” rise in yields that breaks all historical correlations. Investors must remain vigilant; the “higher for longer” regime is not a static environment but a dynamic one. Diversification across jurisdictions and asset classes remains the only “free lunch” in finance. As an engineer-turned-analyst, I remind you: the map is not the territory. Use these data-driven insights as your compass, but always keep your “stop-loss” logic active to protect against systemic failure.
Further Reading
- Solid Power SLDP Analysis: Game-Changing Breakthrough or Mirage?
- Amprius Technologies: The Explosive Growth Path to $30 (2026 Analysis)
- Alphabet Stock Forecast 2030: Epic Bullish Analysis
- Iran War Aftermath: Explosive Survival Strategies for Investors