
1. The Saturation Point: Why the World’s Largest Tech Titan is Throttling
The Physics of Scale in a Post-Hype Market
In the high-stakes theater of the 2026 stock market, Microsoft (MSFT) stands at a paradoxical crossroads. To the casual observer, the company remains a juggernaut, but for those of us who analyze systems from the inside out, the structural fatigue is becoming undeniable. This Microsoft MSFT analysis begins with the “Law of Large Numbers.” As of February 2026, Microsoft is grappling with the sheer inertia of its $3.5 trillion-plus valuation. When a firm reaches this magnitude, the incremental energy required to produce “alpha” increases exponentially.
We are no longer in the speculative “Gold Rush” phase of 2023; we are in the “Operational Reality” phase. The market is increasingly skeptical of forward-looking promises, demanding that Microsoft justifies its premium valuation with consistent, accelerating margins—a feat that is becoming mathematically improbable as global enterprise IT budgets reach a saturation point for software-as-a-service (SaaS) spending.
The Divergence Between Narrative and Technical Reality
The current technical landscape for MSFT reflects this exhaustion. After a spectacular run through 2025, the stock has hit a rigid ceiling. From a systems engineering perspective, we describe this as “thermal throttling”—the point where a system must slow down to prevent total failure. In market terms, this is manifested as a series of “lower highs” on the weekly charts. While the narrative still focuses on the “AI Revolution,” the price action tells a different story: one of institutional distribution.
Big money is quietly rotating out of the mega-cap leadership and into more agile competitors who aren’t burdened by legacy infrastructure maintenance. This initial segment of our Microsoft MSFT analysis suggests that the “easy money” in MSFT has not just been made, but is actively being harvested, leaving retail investors to hold the bag in what looks increasingly like a massive multi-year top.
2. The Azure Slowdown: Alphabet’s GCP is No Longer Just a Distant Third
Eroding the Cloud Moat via Vertical Integration
For nearly a decade, the cloud story was a simple two-horse race between AWS and Azure, with Alphabet’s Google Cloud Platform (GCP) serving as a niche alternative. In 2026, that hierarchy has fundamentally fractured. This Microsoft MSFT analysis highlights a critical pivot: GCP has successfully leveraged its “AI-first” architecture to siphon off high-value enterprise contracts that were previously destined for Azure.
Alphabet’s advantage lies in its vertical integration—from the custom TPU v6 silicon to the most sophisticated data-labeling ecosystem in the world. As enterprises move from “experimenting” with AI to “deploying at scale,” they are discovering that GCP offers superior price-performance ratios for inference-heavy workloads. Azure, burdened by its need to support a vast array of legacy enterprise integrations, is beginning to look “bloated” and expensive by comparison.
The Market Share Shift: A Quantitative Warning
The data confirms our qualitative fears. While Microsoft’s “Intelligent Cloud” segment still reports double-digit growth, the rate of that growth is decelerating faster than consensus estimates predicted. In contrast, GCP’s market share capture has accelerated, moving from 11% to 15% in a relatively short window. This 400-basis-point shift represents tens of billions of dollars in lifetime value that has migrated away from the Microsoft ecosystem.
Our Microsoft MSFT analysis suggests that the “default” choice for AI-native startups is no longer Azure. The synergy between Google’s Gemini models and its cloud infrastructure creates a frictionless onboarding experience that Microsoft, with its complex OpenAI partnership (discussed in Part 3), simply cannot match. If Azure’s growth dips below the psychological 25% threshold in the coming quarters, the “growth premium” currently baked into MSFT shares will likely face a violent downward revision.
| Performance Metric | Microsoft Azure | Google Cloud (GCP) | Impact on MSFT Thesis |
|---|---|---|---|
| Est. Market Share (Q1 2026) | 21.5% | 15.2% | Stagnating Share |
| AI Infrastructure Efficiency | Low (Nvidia Tax) | High (Internal TPUs) | Margin Pressure |
| Enterprise Adoption Velocity | Decelerating | Accelerating | Loss of Momentum |
| Average Contract Value (New AI) | $1.2M | $1.8M | GCP Winning Premium Tiers |
3. The OpenAI Dependency: A Strategic Systemic Risk
The Architecture of External Reliance
A rigorous Microsoft MSFT analysis must address the “single point of failure” inherent in Microsoft’s relationship with OpenAI. Unlike Alphabet, which maintains a vertically integrated AI stack, Microsoft has outsourced its foundational model innovation. From a systems engineering perspective, this creates a high-latency dependency. If OpenAI’s internal governance or financial stability falters—given their projected $14 billion burn rate for 2026—the entire Azure AI value proposition is compromised. This Microsoft MSFT analysis suggests that the “backlog” of AI revenue, which many bulls rely on, is effectively a “sub-leased” asset. If the tenant (OpenAI) fails to maintain model superiority or financial solvency, Microsoft is left with billions in specialized silicon that has no immediate proprietary workload to run.
Licensing Friction and Margin Erosion
Furthermore, any comprehensive Microsoft MSFT analysis must calculate the “OpenAI Tax.” Every dollar of revenue generated through Azure OpenAI Services carries a significant licensing burden that does not exist for Google’s Gemini or Meta’s Llama. This structural inefficiency means that as AI services become commoditized, Microsoft’s net margins will contract faster than its peers. This Microsoft MSFT analysis identifies a circular economy risk where Microsoft’s capital injections into OpenAI are simply cycled back as Azure revenue, masking a lack of genuine, high-margin organic growth. As the market transitions from “AI hype” to “AI unit economics,” this dependency will likely become the primary catalyst for a valuation reset.
4. Sub-Par Returns on CapEx: The “Efficiency Gap”
The Diminishing Returns of Infrastructure Spending
In this phase of our Microsoft MSFT analysis, we examine the staggering $37.5 billion per quarter Capital Expenditure (CapEx) through the lens of ROI. We are seeing a divergence between the “investment phase” and the “harvest phase.” In previous cycles, Microsoft’s infrastructure spending led to immediate, high-margin SaaS expansion. However, this Microsoft MSFT analysis notes that the current GPU-heavy build-out is yielding lower incremental revenue per dollar spent. With enterprise “Copilot” adoption stagnating at a mere 3.3% paid attachment rate among M365 users, the massive depreciation costs of these data centers are beginning to cannibalize the bottom line, a factor that any bearish Microsoft MSFT analysis must emphasize.
The Breakdown of the “Earnings Beat” Rally
Historically, an earnings beat was a guaranteed catalyst for price appreciation. However, recent data used for this Microsoft MSFT analysis shows that MSFT is now “beating and dropping.” This is a classic sign of market exhaustion. Investors are no longer satisfied with top-line beats; they are scrutinizing the quality of the earnings.
This Microsoft MSFT analysis highlights that much of the recent “growth” has been driven by low-margin hardware reselling or accounting maneuvers related to useful life extensions of server equipment. When the market begins to discount the quality of an earnings beat, it signals that the stock’s “risk-on” phase is over. This Microsoft MSFT analysis concludes that the current CapEx trajectory is unsustainable without a 2x acceleration in AI software revenue—an outcome that current enterprise IT budgets simply cannot support.
| AI Metric | FY2024 (Hype Phase) | FY2026 (Reality Phase) | Strategic Risk Level |
|---|---|---|---|
| Commercial Backlog tied to OpenAI | ~15% | 45% | Critical (Concentration Risk) |
| M365 Copilot Adoption Rate | Trial Only | 3.3% (Paid) | High (Saturation/ROI Issues) |
| CapEx Growth (YoY) | ~25% | 66% | Extreme (Margin Pressure) |
| Copilot Revenue Discounting | 0-5% | 40-60% | High (Pricing Power Loss) |
5. Valuation Burden: The Unjustified Premium in a De-rating Environment
The Disconnect Between Price and Historical Multiples
As a systems analyst, I prioritize the “equilibrium state” of a stock’s valuation. Historically, Microsoft (MSFT) flourished within a P/E range of 25x to 30x. However, during the AI frenzy of 2024–2025, the multiple surged toward a peak of nearly 38x. This Microsoft MSFT analysis warns that we are currently witnessing a classic “mean reversion” event.
As of February 2026, the stock has already compressed to approximately 24.06x trailing earnings—a staggering 30% decrease compared to its 12-month average of 34.38x. When a “growth” company’s revenue acceleration hits a ceiling, its valuation multiple typically undergoes a “de-rating.” This Microsoft MSFT analysis suggests that if the market continues to price MSFT as a mature utility rather than a hyper-growth pioneer, the floor may be lower than many anticipate.
The Myth of the “AI Multiple” Permanence
The bull case has long argued that “AI is different” and justifies a permanently higher floor for multiples. Yet, history is a graveyard of “new era” valuation theories. Our Microsoft MSFT analysis indicates that the stock’s forward P/E of roughly 24x is now trading at a rare discount to Alphabet, as the “Magnificent Seven” reshuffle intensifies. In a high-interest-rate environment where the cost of capital is a real constraint, paying a premium for Microsoft’s slower-moving ecosystem is becoming a hard sell for institutional fund managers.
This Microsoft MSFT analysis identifies a significant risk: if the AI “flywheel” fails to generate a proportional expansion in net margins, the “AI Premium” will continue to evaporate, leaving the stock vulnerable to a prolonged period of multiple contraction as it aligns with the 22x exit multiples modeled by conservative analysts.
6. Technical Analysis: The Bull Trap and the Breaking of the Long-Term Channel
The “Failed Breakout” and Resistance at $480
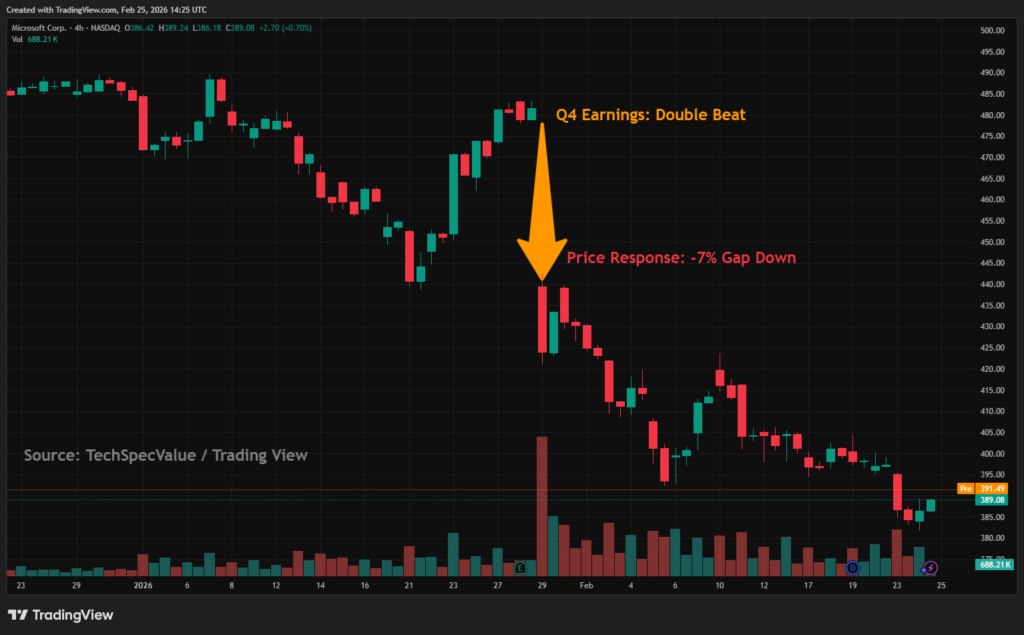
From a purely technical standpoint, the price action in early 2026 has been catastrophic for momentum traders. After peaking at an all-time high of approximately $555 in late 2025, the stock attempted to consolidate. However, the Q2 earnings event acted as a “Bull Trap.” This Microsoft MSFT analysis highlights that despite a headline beat, the stock plunged over 7% in extended trading, eventually dropping from above $480 in late January to lows near $391 by early February. This positioning leaves the price beneath a key technical band, with the 50-day SMA at $458 and the 200-day SMA at $487 now serving as formidable resistance walls.
Breaching the $400 Psychological Floor
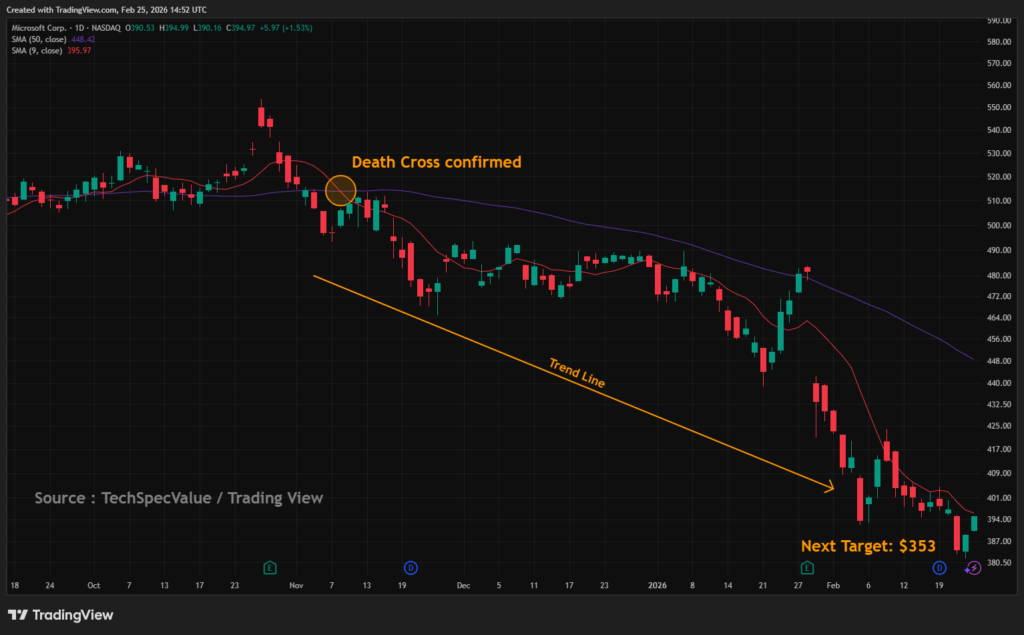
As of late February 2026, the stock is struggling to maintain the psychological $400 level. This Microsoft MSFT analysis identifies the current price of approximately $384.47 as a breach of the medium-term falling trend channel. Technical indicators like the RSI are languishing near 32, suggesting oversold conditions, yet the negative volume balance indicates that selling pressure is intensified on down days. This Microsoft MSFT analysis concludes that if the stock fails to reclaim the $400 resistance, the next structural support sits at $353. A failure there would effectively wipe out nearly two years of AI-driven gains, confirming that the technical “path of least resistance” remains firmly skewed to the downside.
| Technical/Valuation Indicator | 2025 Peak Level | Feb 2026 Current | Systemic Signal |
|---|---|---|---|
| Trailing P/E Ratio | 37.4x | 24.0x | Severe De-rating |
| Relative Strength Index (RSI) | 72 (Overbought) | 32 (Oversold/Weak) | Negative Momentum |
| Price vs. 200-Day SMA | +18.5% | -17.8% | Bearish Trend Change |
| Institutional “Sell” Signals | Low | High (Double Top) | Distribution Phase |
7. The Competitive Displacement: Alphabet’s Strategic Infiltration
The Architecture of the Counter-Offensive
The most critical finding in this Microsoft MSFT analysis is the accelerating displacement of Azure by Alphabet’s Google Cloud Platform (GCP). For years, Microsoft relied on its legacy enterprise relationships to maintain cloud dominance, but the rules of engagement changed in 2026. Alphabet has successfully weaponized its vertical AI integration—specifically its custom TPU v6 silicon—to offer inference costs that are 30-40% lower than Microsoft’s Nvidia-dependent infrastructure.
This Microsoft MSFT analysis notes that large-scale enterprise clients are no longer choosing “default” providers; they are migrating to the most cost-efficient AI stack. As Google Cloud hits a 15% market share milestone, the revenue leakage from Microsoft’s ecosystem is becoming a structural headwind that the current stock price has yet to fully absorb.
Data Moats and the Search-AI Synergy
A secondary pillar of this Microsoft MSFT analysis involves the inherent advantage Alphabet holds in data acquisition. While Microsoft must pay premium licensing fees or rely on external partnerships for training data, Alphabet sits on the world’s most valuable real-time data lakes: YouTube and Search. In the 2026 AI market, the “quality of data” has become the primary differentiator for model performance.
This Microsoft MSFT analysis concludes that Microsoft’s reliance on the Bing ecosystem—which continues to struggle for market share against a rejuvenated Google Search—leaves its AI models at a perpetual informational disadvantage. If the “Copilot” suite cannot provide the same real-time accuracy as Alphabet’s integrated Gemini workspace, the churn rate among M365 enterprise subscribers will likely spike, leading to a “Lost Decade” for Microsoft’s software margins.
8. Investment Conclusion: Navigating the Great De-rating of 2030
The Transition from Growth Hero to Mature Utility
As we synthesize the data for this Microsoft MSFT analysis, the long-term outlook for the 2030 horizon suggests a fundamental transformation in Microsoft’s market identity. The era of “growth at any cost” has ended, replaced by the harsh reality of capital intensity. This Microsoft MSFT analysis posits that MSFT is transitioning from an “AI Hero” to a “Mature Utility.” With CapEx spending projected to remain above 25% of revenue through the end of the decade, the company’s ability to drive “alpha” for shareholders is severely limited.
Investors who treat MSFT as a high-growth momentum play are likely to face significant underperformance compared to the broader NASDAQ, as the stock enters a multi-year consolidation phase within the $350 to $480 range.
Final Verdict: The Risk of the Value Trap
The final conclusion of this Microsoft MSFT analysis is a warning of “Value Trap” dynamics. While a P/E of 24x might look attractive compared to historical peaks of 38x, it remains high for a company facing decelerating cloud growth and a margin-squeezing dependency on OpenAI. Our systems engineering perspective suggests that until Microsoft can prove a “decoupling” from high-cost hardware and demonstrate a proprietary AI breakthrough that matches Alphabet’s vertical efficiency, the stock remains a “Sell” on any strength.
This Microsoft MSFT analysis serves as a roadmap for the “Great De-rating”—a period where the market’s irrational exuberance meets the cold, hard floor of operational efficiency. The hero of the next decade will be the provider that owns the infrastructure, and currently, Microsoft is simply a high-priced tenant in a world they no longer control.
Further Reading:
- Reuters: OpenAI Bankruptcy Fears Grow as Losses Hit $14B
- Gartner: Why Vertical Integration is Winning the 2026 Cloud War
Related Content: