
1. The Fuse of the Oil Surge: 2026 Geopolitical Risk Analysis
The Strait of Hormuz and the Fragility of Global Energy Nodes
The Oil Price Surge of 2026 is not merely a market fluctuation; it is a structural failure of the global energy transit system. As of late March 2026, the Strait of Hormuz—the world’s most critical maritime chokepoint—has transitioned from a zone of tension to a theater of active kinetic disruption. Following the military strikes in early March, tanker traffic through the Strait has plummeted by an estimated 70%, with over 150 vessels remaining anchored outside the Persian Gulf to avoid escalating insurance premiums and missile threats.
From a systems engineering perspective, this represents a loss of nearly 20% of global daily oil and gas supply, creating a “Step Function” increase in spot prices. Unlike previous years where OPEC+ spare capacity could act as a buffer, the current disruption is so localized and physically restrictive that “paper barrels” in the futures market cannot compensate for the missing physical supply, forcing Brent crude to maintain its aggressive trajectory toward the $110–$120 range.
Psychological Warfare and the Speculative Risk Premium
A critical component of the 2026 Oil Price Surge is the psychological de-anchoring of the commodities market. In late March, we are observing a “Fear Multiplier” where the actual physical shortage is being compounded by a massive influx of speculative capital seeking a hedge against global instability. High-frequency trading algorithms are now programmed to front-run any headline involving maritime “Force Majeure” declarations, which have already been invoked by major entities like Qatar Energy and Kuwait Petroleum Corporation.
This creates a feedback loop: as prices rise, physical importers like India and South Korea—who rely on the Strait for over 60% of their energy—are forced into panic-buying to secure strategic reserves, further drying up global liquidity. The result is a market characterized by “extreme right-tail risk,” where the traditional laws of supply and demand are superseded by a desperate race for physical inventory, making any short-term retracement unlikely until a formal naval escort system is fully operational.
Comparative Analysis: Why 2026 Diverges from the 1970s
When comparing the current Oil Price Surge to the historical shocks of 1973 or 1979, the 2026 crisis presents a far more complex “Multi-Domain” threat. In the 1970s, the primary issue was political willpower; today, it is the degradation of the global security architecture combined with a decade of chronic underinvestment in traditional energy infrastructure.
We are currently operating in an environment where global oil inventories are at 10-year lows, leaving no margin for error. Furthermore, the 2026 crisis is unique because it occurs during a high-interest-rate regime, meaning the cost of carrying inventory is significantly higher than in previous decades. This “Double Squeeze”—where energy is expensive to buy and expensive to store—is a systemic anomaly that shifts the break-even point for the entire global industrial base. Analysts who rely on old 1970s models are missing the fact that our modern “just-in-time” supply chains are inherently less resilient to the type of total maritime blockade we are witnessing today.
2. The Fed’s Dilemma: Reigniting Inflation and the Rate Path
The CPI Contagion and De-anchoring Expectations
The persistent Oil Price Surge has effectively neutralized the Federal Reserve’s hopes for a non-inflationary 2026. As of the March 18 FOMC meeting, the Fed has been forced to revise its headline PCE inflation expectations upward to 3.5%, a sharp departure from the 2.4% projected just months ago. This surge is primarily driven by “First-Order” energy effects; gasoline prices in the U.S. are rapidly approaching the $4.50 per gallon mark, which historically serves as a tipping point for consumer sentiment.
In my analysis of the CPI sub-indices, we are seeing a rapid spillover from raw energy costs into secondary sectors like food processing and chemical manufacturing. This “Contagion Effect” means that even if oil prices were to stabilize tomorrow, the inflationary pressure is already “baked into” the supply chain for the next two quarters, making the Fed’s 2% target an increasingly distant mirage and forcing a re-evaluation of all equity valuation models.
‘Higher for Longer’ 2.0: The End of the Pivot Hope
Market participants who spent late 2025 betting on a series of 2026 rate cuts are now facing a brutal reality check. The Oil Price Surge has transformed the “Fed Pivot” into a “Fed Pause” at best, and a “Fed Hike” at worst. According to the latest FedWatch data, the probability of a rate cut in 2026 has collapsed from 90% in January to less than 10% in late March. Jerome Powell’s recent rhetoric emphasizes “vigilance against second-round effects,” signaling that the central bank is more concerned about a wage-price spiral triggered by high energy costs than it is about a minor slowdown in GDP growth.
For the stock market, this means the “Discount Rate” remains structurally elevated. As a stock analyst, I must warn that companies with heavy debt loads—particularly in the Small-Cap (Russell 2000) space—are now entering a “Refinancing Death Spiral” as the hope for lower borrowing costs evaporates in the heat of $100+ oil.
Monetary Policy Scenarios: The Search for a Middle Ground
As we look toward the second half of 2026, the Federal Reserve is trapped in a narrow corridor of stagflation. The Oil Price Surge presents two distinct, equally unpalatable scenarios for monetary policy. Scenario One involves a “Volcker-esque” defensive hike to 6.0% to crush the inflationary expectations being fueled by energy costs; this would almost certainly trigger a hard recession but preserve the long-term integrity of the Dollar.
Scenario Two is a “Grudging Accommodation,” where the Fed accepts a 3-4% inflation rate to prevent a total collapse in the labor market. Currently, the bond market is pricing in a version of Scenario Two, leading to a significant inversion of the yield curve that hasn’t been seen with this intensity since 2023. For investors, the takeaway is clear: the “Fed Put” has been replaced by an “Energy Call.” The central bank is no longer the market’s protector; it is a reactive force tethered to the price of a barrel of Brent crude.
3. Sector Divergence: Winners vs. Losers in a High-Energy Regime
The Strategic Ascent of Energy and Defense as Macro Hedges
In the wake of the Oil Price Surge of 2026, the traditional equity hierarchy has been completely inverted. The Energy sector, represented by the XLE, has transitioned from a cyclical laggard into the market’s primary engine of free cash flow (FCF). For industry giants like ExxonMobil (XOM) and Chevron (CVX), the current $110+ Brent environment allows for a massive expansion of shareholder returns, as their “Sustaining CapEx” models were built for a $60–$70 oil world.
Every dollar increase above that threshold flows directly to the bottom line, fueling record-breaking buyback programs that provide a mechanical floor for their stock prices. Simultaneously, the Defense sector, led by Lockheed Martin (LMT) and Northrop Grumman (NOC), is experiencing a “Supercycle” of its own. Geopolitical instability in the Middle East—the very catalyst for the energy spike—has forced global governments into an aggressive re-armament phase. From a systems engineering perspective, these two sectors now function as a “Dual-Engine Hedge,” thriving on the volatility that is currently paralyzing the broader S&P 500.
The Crushing Weight of Fuel Costs on Logistics and Aviation
Conversely, the “losers” of the 2026 Oil Price Surge are those industries where fuel is a primary, non-discretionary operational input. The aviation industry, specifically legacy carriers like Delta (DAL) and United, faces a catastrophic “Double Squeeze”: surging jet fuel crack spreads and a potential cooling of consumer travel demand as inflation erodes disposable income. Similarly, the logistics and freight giants like FedEx (FDX) and UPS are seeing their operating margins systematically dismantled.
Even with the implementation of “Variable Fuel Surcharges,” there is a significant temporal lag between the spike in diesel prices and the collection of fees from customers. In a high-velocity price environment, this lag results in a massive “Margin Leakage” that has forced analysts to revise 2026 earnings estimates downward by nearly 15%. For the stock analyst, these sectors represent a “Value Trap” zone where low P/E ratios are merely a reflection of deteriorating fundamental health and an inability to scale costs in real-time.
Consumer Discretionary and the Erosion of Purchasing Power
The final casualty in this sector rotation is the Consumer Discretionary space, particularly e-commerce and retail leaders like Amazon (AMZN). The Oil Price Surge acts as a regressive tax on the global consumer, effectively siphoning billions of dollars away from discretionary spending and toward essential heating and transportation costs. As gasoline prices breach the psychological $5.00 mark in several U.S. states, the “Share of Wallet” available for electronics, apparel, and non-essential services is shrinking at the fastest rate since the 2008 financial crisis.
Amazon, in particular, faces a two-fold threat: a sharp increase in “Last-Mile” delivery costs and a softening of demand in its core retail division. While its AWS cloud division provides a buffer, the retail segment is increasingly sensitive to the energy-driven inflation that is currently dampening consumer confidence. Investors must recognize that in 2026, the “Consumer Resilience” narrative is being tested by the coldest reality of all—the high cost of physical movement and basic survival.
4. Big Tech’s Resilience: Testing the AI Momentum
The Cash Fortress and Interest Rate Immunity
Despite the headwinds created by the Oil Price Surge, the “Mega-Cap” technology sector continues to exhibit extraordinary downward price rigidity. Companies like Microsoft (MSFT), Alphabet (GOOGL), and Apple (AAPL) have spent the last half-decade optimizing their balance sheets into what I call “Cash Fortresses.”
In 2026, these entities hold collective cash reserves exceeding $500 billion, allowing them to remain virtually immune to the Federal Reserve’s “Higher for Longer” interest rate trajectory. In fact, in a high-rate environment, these cash-rich firms generate substantial interest income on their treasury holdings, effectively subsidizing their own R&D cycles. From an engineering standpoint, this creates a “Negative Beta” effect against credit market stress; while small-cap tech firms struggle to survive 6% interest rates, the giants are using their capital depth to aggressively acquire distressed competitors and consolidate market share, making them the ultimate “Quality” play in a volatile energy regime.
AI as the Strategic Deflationary Engine for Corporations
The primary reason the tech sector has not succumbed to the Oil Price Surge is the accelerating “AI Efficiency Cycle.” As energy and labor costs skyrocket, global corporations are being forced to automate at an unprecedented pace to protect their remaining margins. NVIDIA (NVDA) remains at the epicenter of this trend, as its H200 and subsequent Blackwell chips are no longer seen as “luxury” tech investments, but as essential tools for survival.
AI is the most potent deflationary force in the 2026 economy; it allows a logistics firm to optimize delivery routes to save fuel, or a manufacturer to reduce scrap rates through predictive maintenance. Consequently, the capital expenditure (CapEx) toward AI infrastructure has become “De-correlated” from the broader macro slowdown. Institutional investors are willing to pay a premium for NVDA and MSFT because these firms provide the software and hardware necessary to fight the very inflation that the energy crisis has unleashed.
Assessing the Limits of Tech Resilience
However, even the strongest systems have a “Maximum Operating Temperature,” and for Big Tech in 2026, that limit is defined by data center power consumption. The Oil Price Surge indirectly impacts the technology sector through the rising cost of electricity and the massive cooling requirements of AI server farms. As utility providers in regions like Northern Virginia and Dublin raise industrial rates to compensate for higher natural gas and diesel costs, the “Cloud Margins” for Azure and Google Cloud are coming under increased scrutiny.
We are seeing a distinct shift where investors are now auditing the “Energy Efficiency” of AI models as a key performance indicator. A company like Meta (META) that can deliver the same inference capabilities with 20% less power will command a significant valuation premium. In the final analysis of 2026, the tech sector’s survival is not just about code and silicon; it is about the mastery of the physical energy grid in a world where every kilowatt-hour has become a strategic asset.
| Sector | Key Tickers | Sensitivity to Oil | 2026 Outlook |
|---|---|---|---|
| Energy | XOM, CVX, XLE | High Positive | Bullish (Cash Flow Focus) |
| Big Tech | MSFT, NVDA, AAPL | Neutral (Rate Sensitive) | Resilient (AI Momentum) |
| Logistics | FDX, UPS, DAL | High Negative | Bearish (Margin Squeeze) |
5. The 2026 Earnings Narrative: The Power of Pricing
The Survival of the Fittest: Defending Operating Margins
As the 2026 earnings season unfolds, the primary metric of institutional scrutiny has shifted from top-line revenue growth to “Operating Margin Resilience” in the face of a sustained Oil Price Surge. In a macro environment where energy and raw material costs are highly volatile, only companies with extreme “Pricing Power” can maintain their profitability without sacrificing market share. Systems engineering teaches us that a process is only as stable as its ability to absorb input fluctuations without compromising output quality.
In the corporate world, this translates to the ability to pass costs directly to the end consumer. We are currently witnessing a “K-shaped” divergence within the S&P 500, where firms with high brand equity and essential services—such as Costco (COST) or Coca-Cola (KO)—are expanding their margins, while “price-takers” in commoditized sectors are facing a brutal margin squeeze that threatens their 2026 dividend distributions.
Analyzing the ‘Cost-Plus’ Pricing Evolution
The 2026 corporate strategy has evolved into what I call “Dynamic Cost-Plus Modeling,” a response to the rapid fluctuations caused by the Oil Price Surge. Historically, companies adjusted prices quarterly; however, the current volatility has forced a shift toward real-time pricing adjustments powered by machine learning. Companies like PepsiCo (PEP) and Procter & Gamble (PG) have demonstrated a remarkable ability to utilize AI-driven demand elasticity models to tweak prices weekly, ensuring that every cent of increased logistics and resin cost is accounted for.
For the stock analyst, the “Winning” companies are those that have successfully decoupled their stock performance from their input costs. This structural shift is creating a massive premium on “Quality” factors, where balance sheet strength and market dominance are no longer just safety features but the primary engines of alpha generation in a high-cost world.
The Margin Compression Trap for Mid-Cap Equities
While the mega-caps navigate the storm with sophisticated hedging and global scale, the Russell 2000 and mid-cap sectors are increasingly vulnerable to the Oil Price Surge. These smaller firms often lack the capital to negotiate long-term energy contracts and do not possess the brand leverage to pass on 10–15% price hikes to a thinning consumer base.
This creates a “Margin Compression Trap” where revenue may appear stable in nominal terms, but real earnings are evaporating under the heat of 6% interest rates and $115 oil. From a data-driven perspective, the correlation between high energy prices and mid-cap credit defaults is reaching a 10-year high. Investors must be wary of “Value Traps” in the industrial and regional retail sectors that look cheap on a P/E basis but are fundamentally broken on an EBITDA-to-Interest-Expense basis due to the dual pressure of high rates and high energy.
6. Technical Thresholds: S&P 500 and Brent Crude Criticality
Mapping the S&P 500 Support Levels and the VIX
From a technical analysis standpoint, the S&P 500 is currently testing its long-term ascending support channel, which has been under immense pressure due to the Oil Price Surge. With the 200-day moving average acting as a “line in the sand” for institutional algorithms at approximately 4,850, any breach below this level—triggered by a sustained Brent crude price above $120—could lead to a systematic de-risking event.
We are also monitoring the VIX (Volatility Index) as it approaches the “Contagion Zone” above 25. Unlike the 2024-2025 period of low volatility, the 2026 market is characterized by “Fat Tail” risks, where a single geopolitical headline from the Strait of Hormuz can shift the entire index by 2.5% in a single session. As an analyst, I utilize the VIX not just as a fear gauge, but as a tactical entry signal; historically, spikes in the VIX accompanied by oil price stabilization have provided the best risk-reward entries for long-term positions.
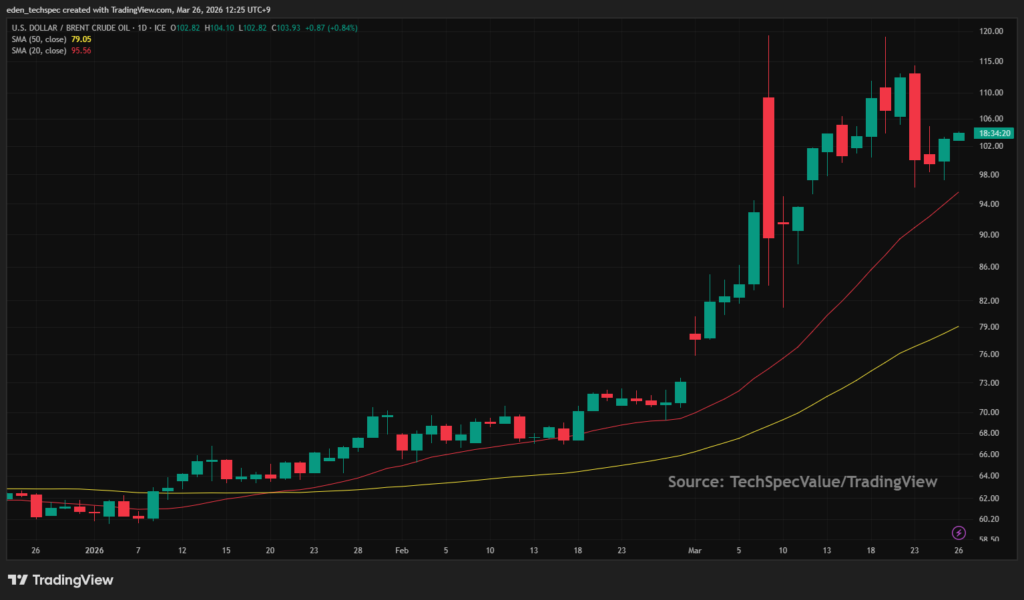
Brent Crude: The $120 Psychological and Physical Barrier
Brent crude is currently oscillating in a high-velocity range, with the $110 to $120 corridor representing a significant psychological and physical resistance zone for the Oil Price Surge. Technical indicators such as the RSI (Relative Strength Index) suggest that while oil is technically “overbought” in the short term, the lack of a “supply-side” catalyst—such as a de-escalation in the Middle East—prevents a significant retracement.
If Brent sustains a weekly close above $125, we enter a “Demand Destruction” phase where the price of energy becomes so high that it forces a global economic shutdown, leading to an eventual price collapse. This is the “Inflection Point” that systems analysts watch closely. The correlation between the S&P 500 and Brent has turned sharply negative (-0.75), meaning that for every $5 increase in oil, we can expect a corresponding 1.5% drag on broad equity valuations until the supply chain stabilizes.
Cross-Asset Correlation: The Dollar and Energy Convergence
A unique technical phenomenon of 2026 is the simultaneous strengthening of both the U.S. Dollar (DXY) and Crude Oil during this Oil Price Surge. Historically, these two assets moved inversely; however, in the current “Crisis Regime,” both are acting as conduits for global capital flight. The Dollar is sought for its high yield and relative safety, while Oil is sought for its physical scarcity.
This “Double Tightening” effect—where the currency gets stronger and energy costs get higher—is a nightmare for emerging markets and international corporations that earn in weakened foreign currencies but must pay for energy in expensive Dollars. Our technical models suggest that this convergence will persist until the Fed officially signals a pause in its “Higher for Longer” stance, making the DXY/OIL pair the most important “Macro Dashboard” for any serious 2026 investor.
| Asset Class | Support Level | Resistance Level | Risk Indicator (VIX) |
|---|---|---|---|
| S&P 500 Index | 4,800 (200-MA) | 5,600 (ATH) | 25.0+ (Critical) |
| Brent Crude Oil | $92.50 | $122.00 | High Volatility Expected |
7. Conclusion & Strategy: The ‘Energy Hedging’ Portfolio
Tactical Allocation: The Power of Energy ETFs and Dividend Growth
In the high-velocity environment created by the Oil Price Surge of 2026, the most effective defense for a U.S. equity portfolio is a proactive “Energy Hedge.” This involves maintaining an overweight position in the Energy Select Sector SPDR Fund (XLE) or the Vanguard Energy ETF (VDE), which serve as natural offsets to the rising fuel costs that depress the rest of your holdings.
However, a sophisticated strategy must be more nuanced than simply chasing crude futures. I recommend a “Barbell Strategy” for the remainder of 2026: on one side, high-conviction energy producers with low debt-to-equity ratios like Occidental Petroleum (OXY); on the other, high-quality Dividend Growth stocks found in the Schwab US Dividend Equity ETF (SCHD). These dividend-paying entities provide a critical, non-correlated cash flow stream that acts as a buffer against the price volatility of growth stocks, ensuring your portfolio remains “solvent” during periods of macro contraction.
Preparing for the Pivot: The Mean Reversion Scenario
While our primary focus has been the sustained Oil Price Surge, a systems-oriented investor must always engineer a path for the eventual “Mean Reversion.” History demonstrates that “the cure for high prices is high prices,” as they eventually trigger massive demand destruction and a subsequent supply surge. Therefore, your 2026 portfolio must remain liquid enough to pivot if Brent crude breaks below its $90 support level later in the year.
We are currently monitoring the “Inventory-to-Sales” ratios in the U.S. industrial sector as an early warning sign of this cooling. Should a recessionary print emerge in the third or fourth quarter of 2026, the strategy shifts instantly from “Inflation Protection” back to “Growth Capture,” specifically targeting beaten-down Small-Cap Tech and Consumer Discretionary sectors that would benefit most from a cooling of the energy-driven interest rate cycle.
Final Thoughts: Resilience through Analytical Discipline
Navigating the 2026 market requires the clinical detachment of a systems engineer and the foresight of a veteran analyst. The convergence of the Oil Price Surge, the Fed’s “Higher for Longer” policy, and the accelerating AI revolution has created a market environment that rewards structural depth over superficial trend-following.
By focusing on “Pricing Power,” “Cash Fortress” balance sheets, and tactical “Energy Hedging,” you are not just surviving the current volatility—you are engineered to profit from it. Remember, in a world of geopolitical noise, the most reliable signal is found in the hard data of operating margins and technical support levels. Stay disciplined, monitor the $120 Brent threshold, and ensure your asset allocation is built to withstand the “Fat Tail” risks of this new energy paradigm.
Further Reading:
- U.S. Energy Information Administration (EIA) Short-Term Outlook
- Federal Reserve Monetary Policy Report – March 2026 Update
Related Content: